PICKIT INSIGHTS
Increase the usage
of your assets
Boost your brand intelligence and brand asset usage.
Track search terms, results, and downloads with actionable analytics
Why Pickit Insights™?
It provides a comprehensive, yet intuitive, analysis of your assets' usage, painting a crystal-clear picture of current trends and helping you predict your future needs, providing you with invaluable information that will enable you to know which brand assets to invest in, take the guess work out of creating and sourcing brand assets and allowing you to know what types of content will be successful.
Did you know that up to 70% of digital assets are either underused or not used at all?
Some of the most common causes are decentralized storage, disorganized assets and distribution issues.
Search data
We gather data from the usage of your brand assets from Microsoft 365, Google Workspace and from the web. In the Searches view, you can see a word cloud that utilizes text size and color to display search activity indicate how your asset library is performing based on the searched keywords.
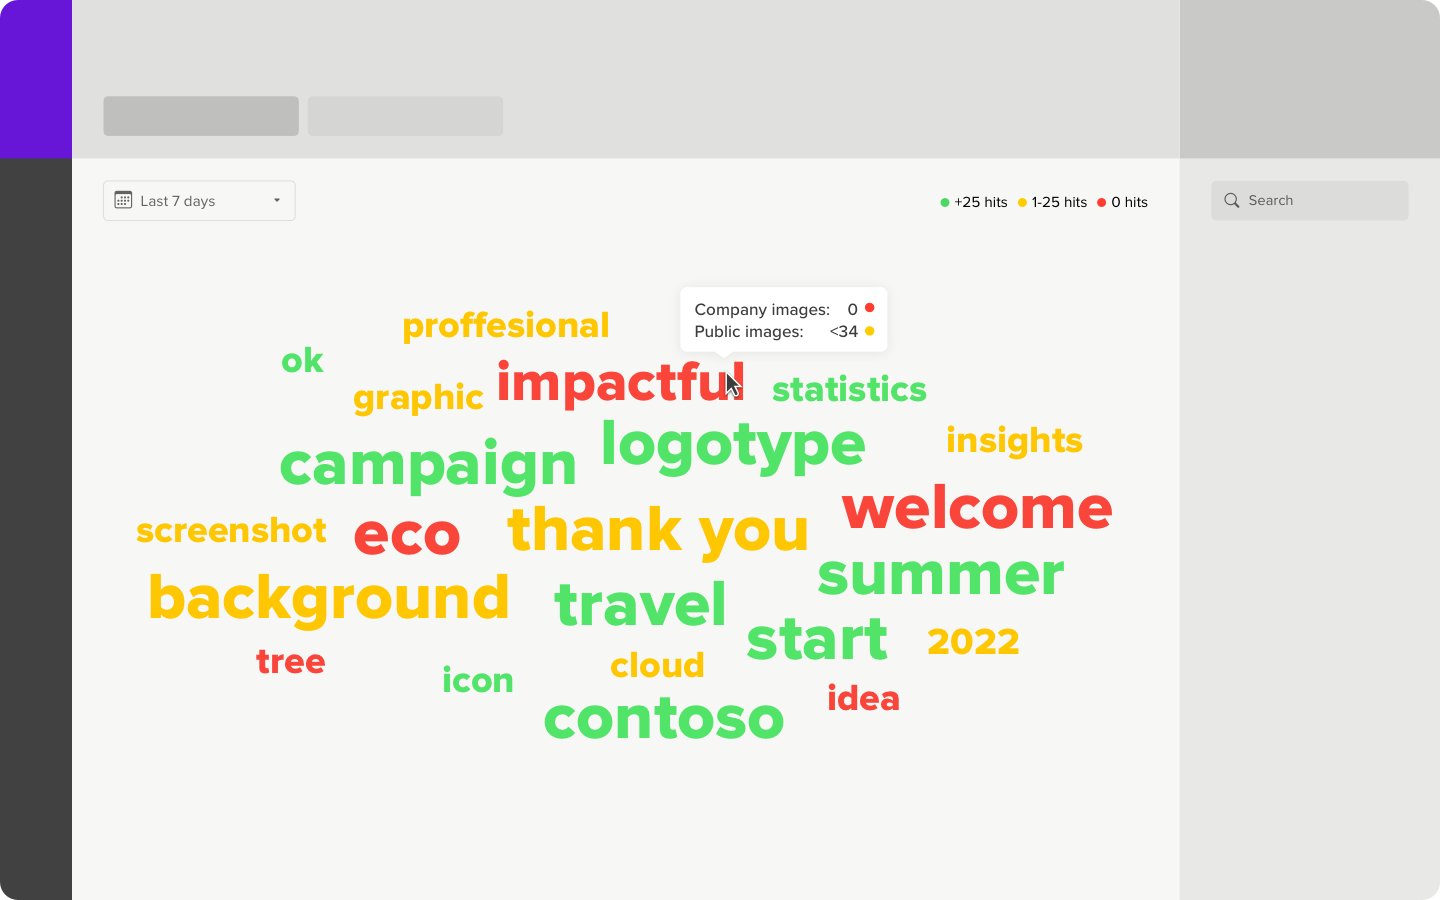
You can hover over a word to see the exact number of images it returns. The larger the word, the more times it's been searched. Green words generate more than 25 results, yellow – between one and 25 images, and red words don't generate any results.
In the top right corner, you'll see a toggle prompting you to display statistics for either the last week or month. Here you can also toggle between activity made in your Company Images vs. Pickit Stock™ section.
You can use the Searches data to better understand how people search for images and identify areas of improvement. For example, are images tagged with the right words? Do people understand what words they should be searching for to find images? Are you lacking any content altogether?
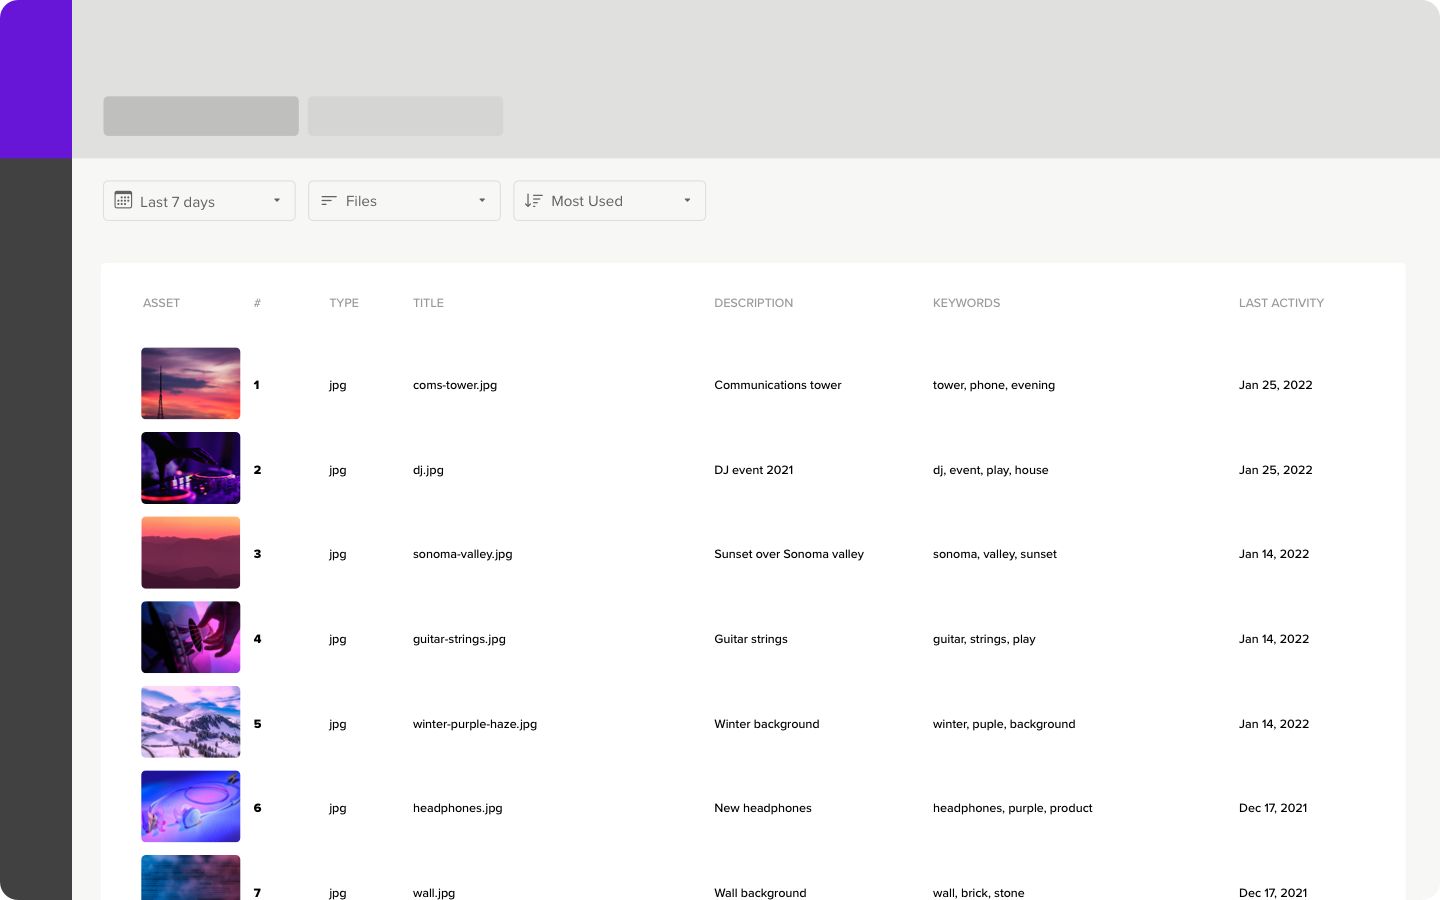
Top lists
See your most and least-used images and collections, as well as update their metadata.
Choose to sort your most-used and least-used collections based on views, the average number of inserts per view, or when they were last updated.
Better understand how people are interacting with your collections and identify areas of improvement. For example, are certain collections performing better than others because of their placement in the asset library; like a Hero or Featured Collection?
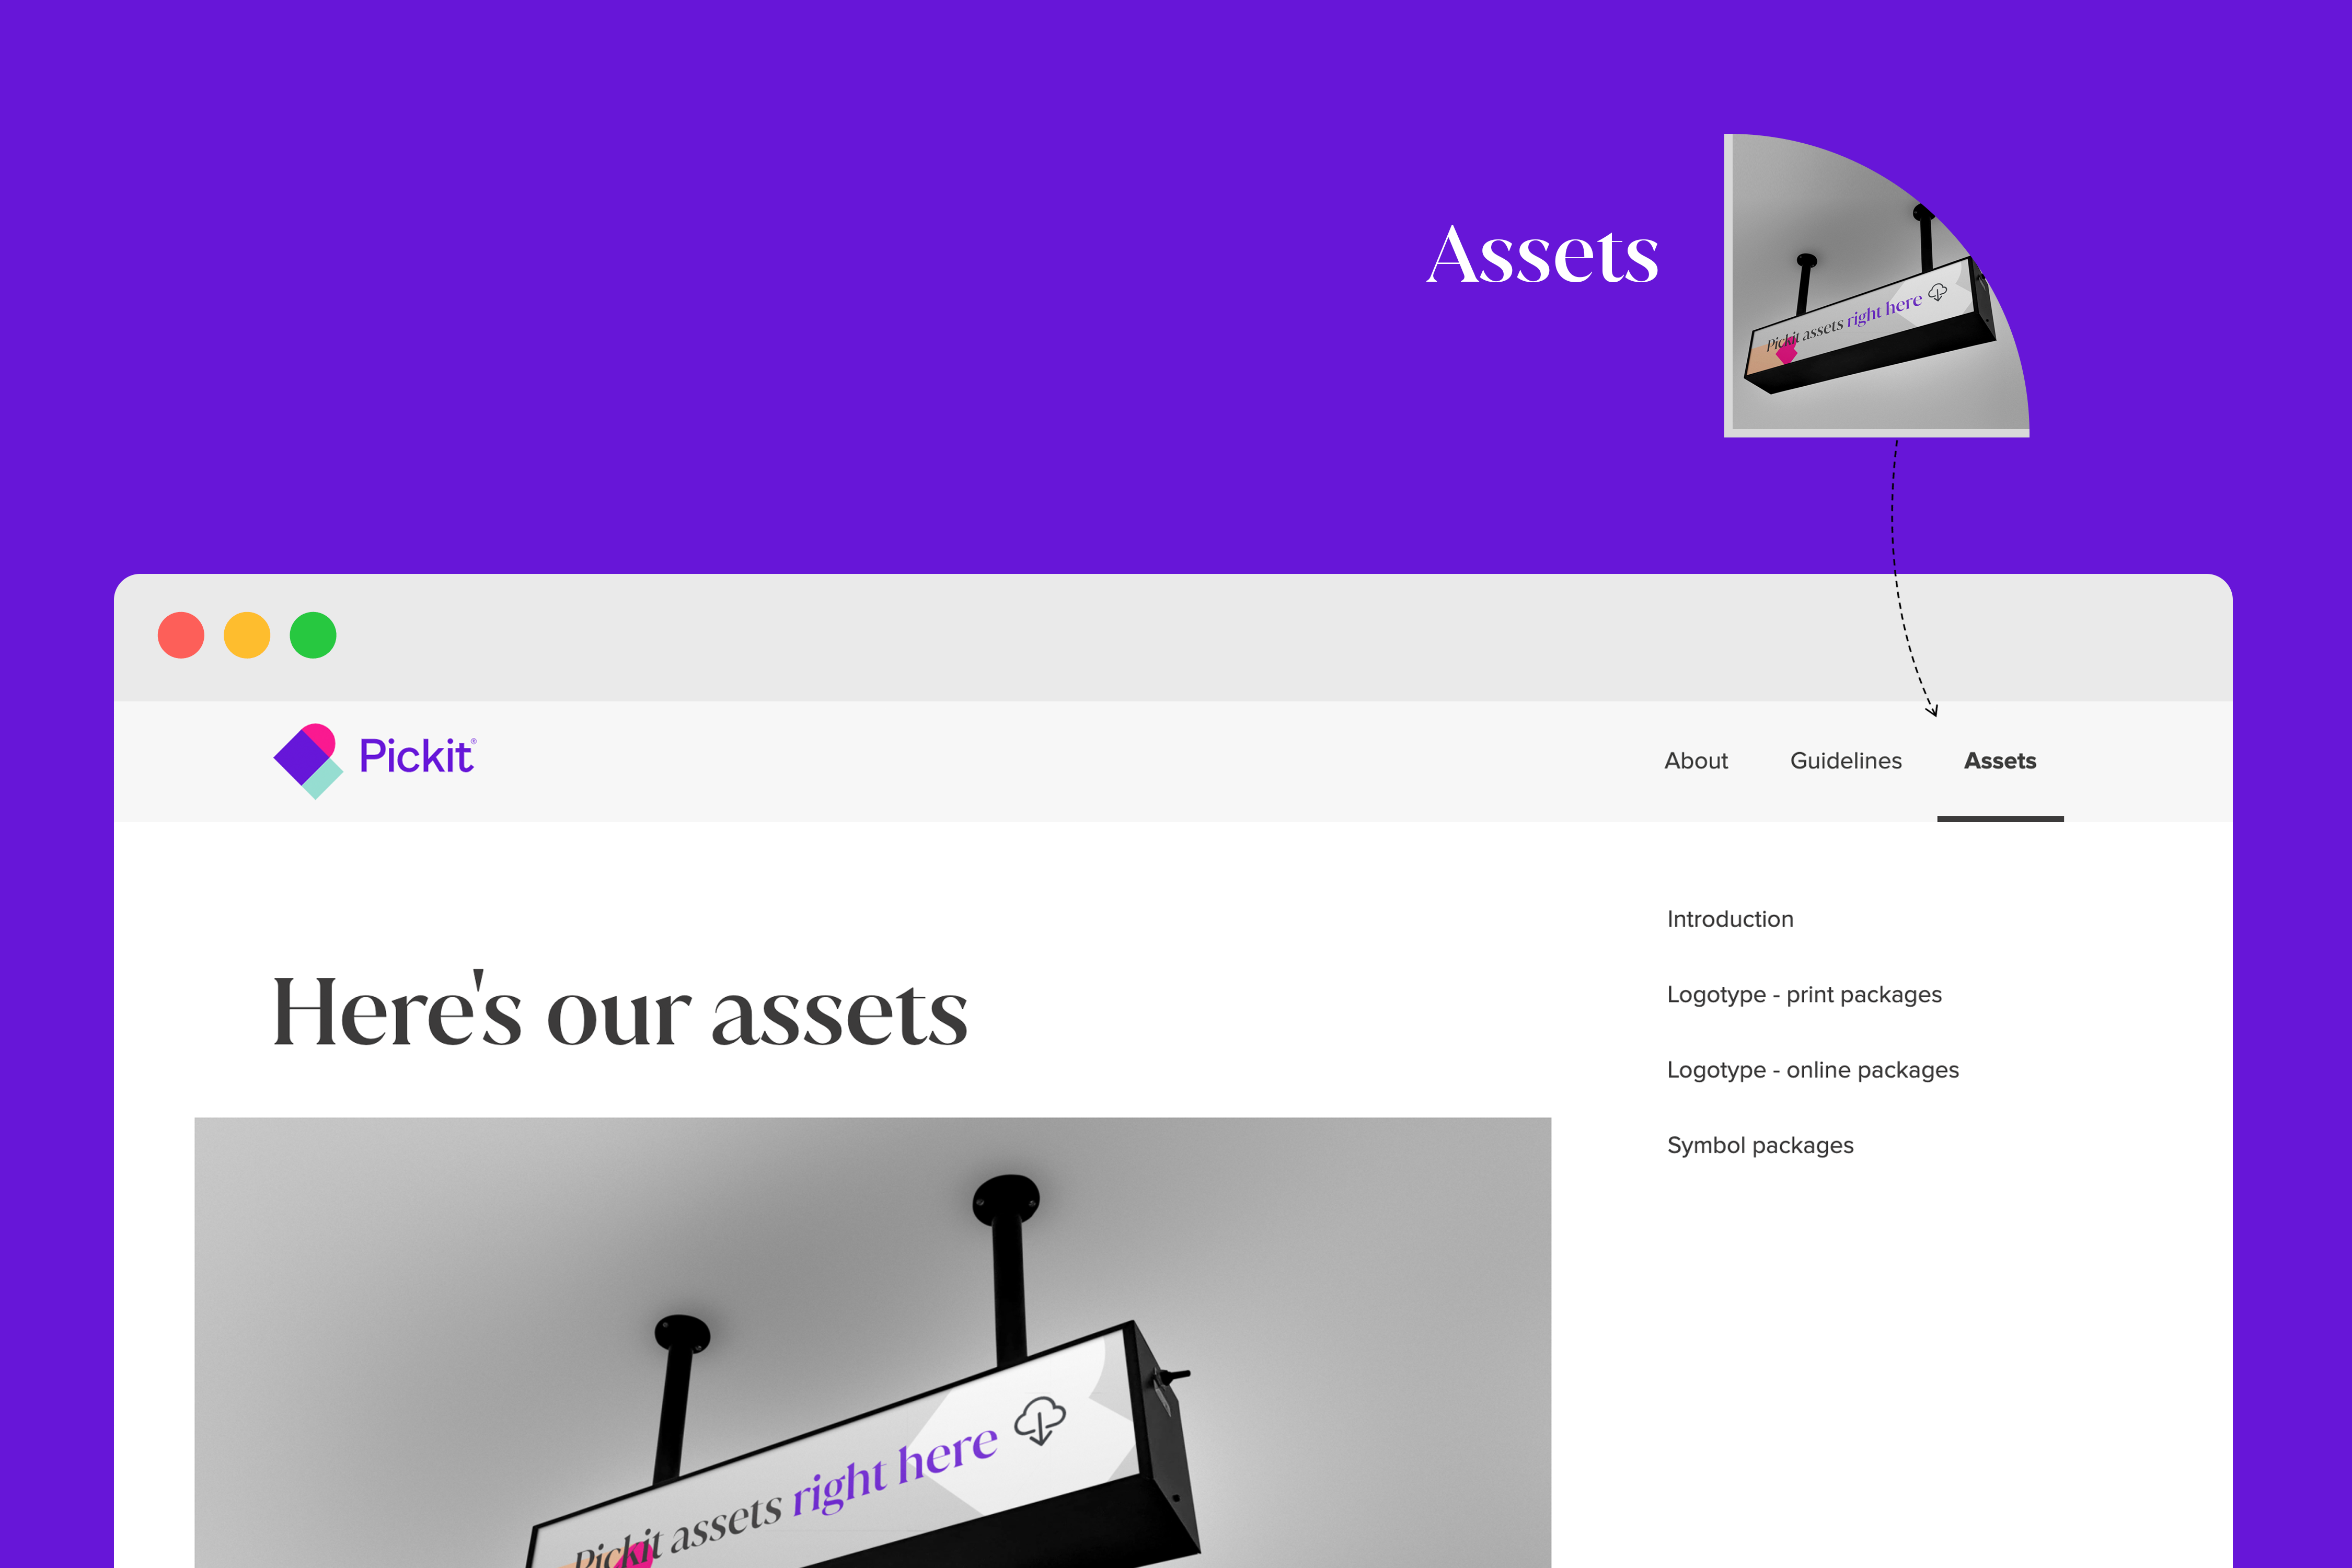
Assets section
Imagine sending a Brand Guide to your team explaining how to use assets and actually bundling the assets together with the guide so they're at everyone's fingertips when they need them. The built-in asset library means you never need to cross your fingers that people will find the right files after reading the guidelines again – they'll always be just a click away.
More products
We offer customized solutions that are specifically designed to meet the unique requirements of every brand. Our products enhance and expand the capabilities of Pickit's central digital asset management solution. Further details regarding this can be found in the information provided below.

Pickit Brand
This module connects your end-users to the relevant brand assets and accompanying information about how to use them in an intuitive portal that's both appealing and accessible for everyone.

Pickit Boards
This module is designed to help you bundle and share contextual content in an appealing, accessible package. It is an easy-to-build, responsive microsite that allows you to quickly distribute assets.

Pickit Family
This module lets you implement a flexible, multi-brand architecture. It simplifies the way asset libraries are created and controlled across multiple instances that live under the same umbrella.
See how Pickit can
help your organization
product specialists today. You won’t regret it.